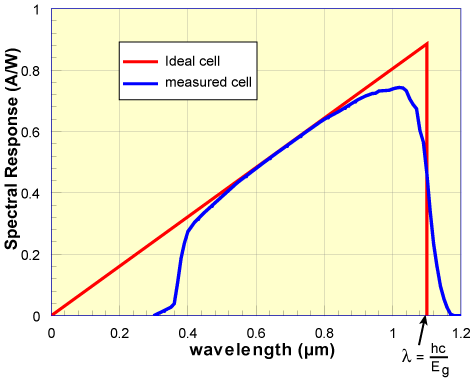
The spectral response is conceptually similar to the quantum efficiency. The quantum efficiency gives the number of electrons output by the solar cell compared to the number of photons incident on the device, while the spectral response is the ratio of the current generated by the solar cell to the power incident on the solar cell. A spectral response curve is shown below.
The spectral response of a silicon solar cell under glass. At short wavelengths below 400 nm the glass absorbs most of the light and the cell response is very low. At intermediate wavelengths the cell approaches the ideal. At long wavelengths the response falls back to zero. Silicon is an indirect band gap semiconductor so there is not a sharp cut off at the wavelength corresponding to the band gap (Eg = 1.12 eV).
The ideal spectral response is limited at long wavelengths by the inability of the semiconductor to absorb photons with energies below the band gap. This limit is the same as that encountered in quantum efficiency curves. However, unlike the square shape of QE curves, the spectral response decreases at small photon wavelengths. At these wavelengths, each photon has a large energy, and hence the ratio of photons to power is reduced. Any energy above the band gap energy is not utilized by the solar cell and instead goes to heating the solar cell. The inability to fully utilize the incident energy at high energies, and the inability to absorb low energies of light represents a significant power loss in solar cells consisting of a single p-n junction.
The spectral response and the quantum efficiency are both used in solar cell analysis and the choice depends on the application. The spectral response uses the power of the light at each wavelength whereas the quantum efficiency uses the photon flux. Converting QE to SR is done with the following formula:
$$SR=\frac{q \lambda}{h c} QE$$
Simplifying gives:
QE to SR in nm
or
QE to SR in um
The graph below is similar to the quantum efficiency graph shown on the previous page except that the spectral response is plotted instead of the quantum efficiency.
Internal spectral response. Lp is the emitter diffusion length (µm), Sp is the front surface recombination velocity (cm/s), Ln is the base diffusion length (µm), Sn is the rear surface recombination velocity (cm/s). Click on the graph for numerical data.
- Log in or register to post comments
- 6 comment(s)
 Español